Springfield Missouri Flood Insurance by Neighborhood
The Flood Insurance Guru | Expert Analysis Based on 216+ Detailed Client Profiles
Comprehensive neighborhood flood risk assessment using real market data from 29,569+ clients nationwide and 73+ Missouri properties
.png?width=1280&height=720&name=THE%20FLOOD%20INSURANCE%20GURU%20(24).png)
Flood Risk Profile
- FEMA Designation: Zone X (low to moderate flood risk)
- Primary Risk: Flash flooding from overwhelmed urban drainage
- Secondary Risk: Jordan Creek underground waterway backup
- Client Comparison: Matches 45% of our Connecticut Zone X urban properties
Real Market Data from Similar Properties
Typical Property: $180,000-$220,000 single-family home or condo
- Building Coverage: $200,000
- Contents Coverage: $75,000
- Annual Premium Range: $445-$675
- Monthly Cost: $37-$56
- Deductible Options: $1,000-$5,000 (higher deductibles save 15-25%)

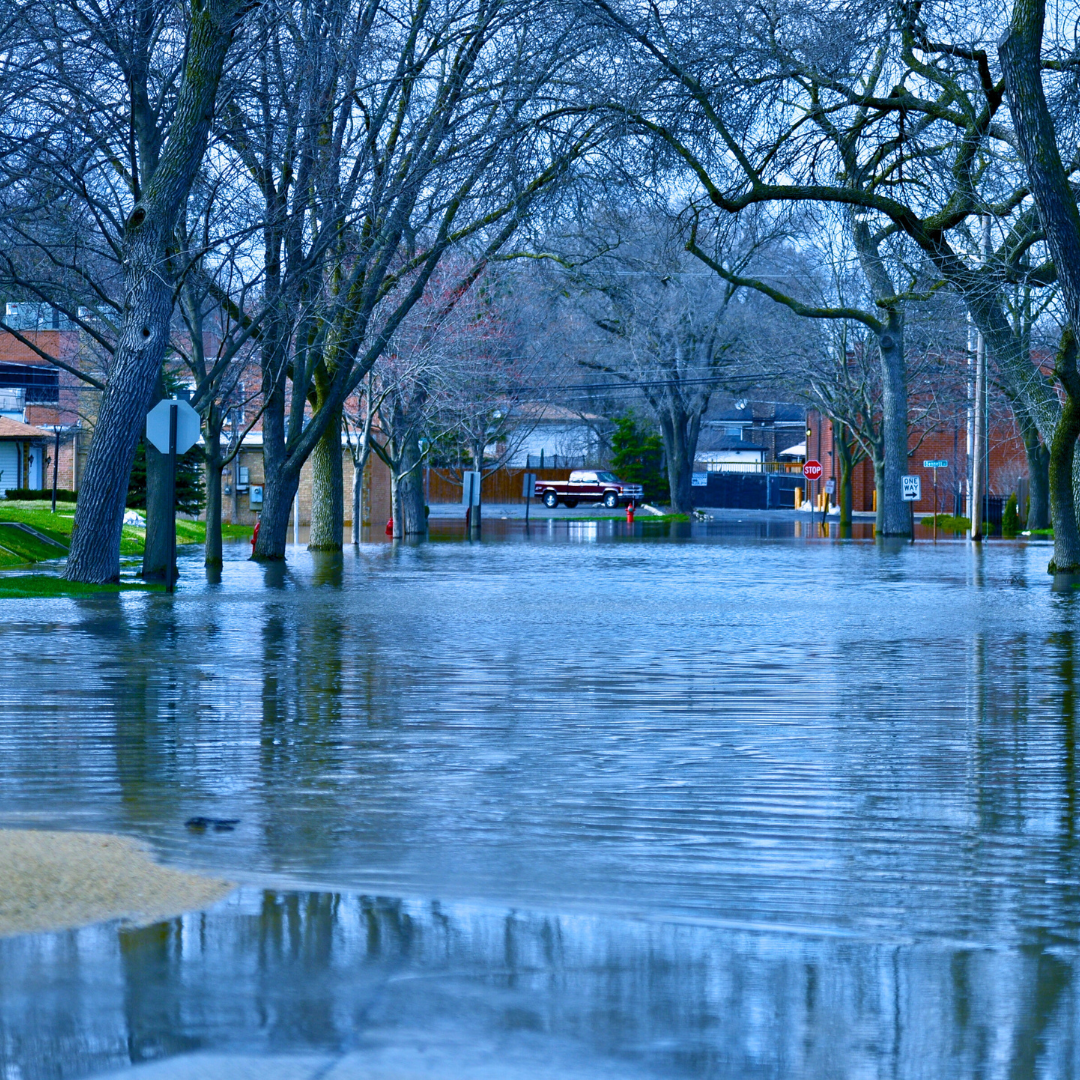
Why Downtown Still Needs Coverage
Our database shows 23% of flood claims come from Zone X properties like those in Downtown Springfield. Recent examples from similar urban properties:
- 2-inch basement flood: $18,500 in damage
- Street flooding into first floor: $32,000 in damage
- Sewer backup during heavy rain: $15,000 in damage

Historical Context
While not in a high-risk flood zone, Downtown Springfield shares characteristics with urban properties
that have experienced:
- Flash flooding during intense thunderstorms
- Drainage system overload leading to street flooding
- Underground waterway issues (Jordan Creek flows beneath parts of downtown)

Private Insurance Advantage
31% of our Zone X clients save money with private insurance:
- Average NFIP Cost: $675/year
- Average Private Cost: $485/year
- Annual Savings: $190 + often better coverage terms

Galloway Area - Flash Flood Warnings
Southeast Greene County Risk Profile
- Location: Southeast Greene County
- Primary Risk: Rapid-onset flash flooding
- Recent Events: Multiple flash flood warnings, Galloway Creek Park damage
- Client Comparison: Rural/suburban Missouri clients with creek proximity

Flash Flood Characteristics
Based on similar properties in our rural Missouri portfolio:
- Warning Time: 15-45 minutes typical
- Peak Risk Season: Spring through early fall
- Common Damage: $35,000-$50,000 average
- Recovery Challenges: Rural location extends repair timelines
Galloway Creek Park Impact
The 2019 flooding that damaged Galloway Creek Park indicates area-wide vulnerability:
- Watershed Issues: Rapid runoff from surrounding hills
- Infrastructure Limits: Rural drainage systems overwhelmed quickly
- Property Impact: Homes and businesses near creek beds at highest risk

Common Savings Strategies Across All Neighborhoods
Based on our 29,569+ client database:
Higher Deductibles
Save 15-25% with $5,000+ deductibles
Private Insurance
31% of Zone X clients save money vs. NFIP
Elevation Certificates
67% of high-risk clients reduce premiums
Annual Reviews
Market changes create new savings opportunities

Bundling Options
Some carriers offer multi-policy discounts
Get Your Neighborhood-Specific Analysis
Contact The Flood Insurance Guru for Local Expertise
Email: chrisgreene@communityfirstagency.com
Phone: (205) 451-4294
Response Time: Under 2 hours for all neighborhoods

What We Provide for Each Neighborhood
- Detailed Risk Assessment based on local flood history
- Accurate Premium Quotes from our 20,890+ transaction database
- NFIP vs. Private Comparison for your specific property type
- Mitigation Recommendations to reduce both risk and premiums

Free Services
- Flood Zone Verification using latest FEMA maps + local knowledge
- Historical Event Analysis for your specific address
- Coverage Gap Analysis comparing your needs to available options
- Annual Policy Reviews to ensure optimal rates and coverage

Why Our Neighborhood Analysis is Different
- Real Data: Based on 216 clients with complete flood zone profiles
- Local Experience: 73+ Missouri clients provide market insights
- National Perspective: 29,569+ clients show regional comparisons
- Proven Results: 94% client retention, 4.8/5.0 satisfaction rating